March 8, 2022

In this blog, Cultural Attaché Quincy Hall examines the survey data gold that is ‘prefer not to answer’ as an answer. He also reveals the world’s best (and only) Jean-Paul Sartre joke.
A watered-down soundbite of one of French existentialist Jean-Paul Sartre’s precepts is this:
The absence of something is still something.
For example, you are meeting up with Alice at a bar. You go into the bar and scan the room. As you look at each person, they are at the same time a) the person that they are and b) not Alice. As the gatherer of information, ie: the person looking for Alice, the absence of being Alice in other people is just as important as being Alice.
(Keep that theory in your head, as below I will finish this blog with a related joke).
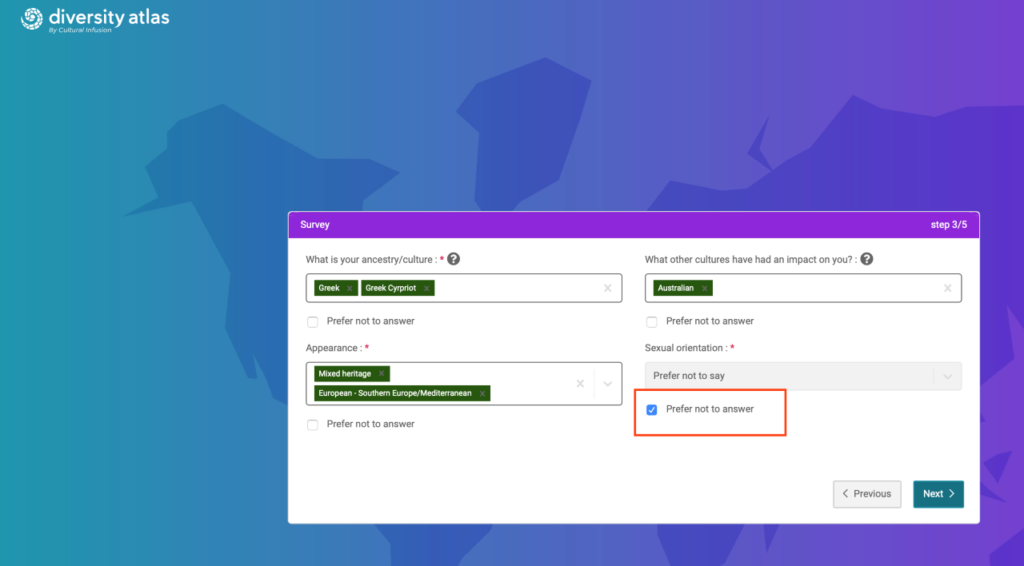
With our Diversity Atlas survey, we have 28 core questions and for each, ‘Prefer Not To Answer’ is an option. This is for many reasons, most pertinently legal ones, but also we find having that offering ensures a better response rate as it puts the gathering of ‘sensitive information’ deep into the hands of the participant. When we’re asking questions that touch on sexuality, disability and ethnicity, we know that some / many people may very well be guarded in their offerings, which is their right.
But the good news is that we consider ‘Prefer not to Answer’ as an answer in and of itself. It tells us something. The absence of an answer is just as meaningful as the presence of one.
For instance, if we see a trend whereby that in Country X ‘Prefer Not To Answer’ on the Religion question is much higher than in Country Y, that sends an immediate and obvious message that in Country X, religious freedom (or freedom from religion) might be less embraced.
Likewise, the same could be said for internal comparisons. If Department X of a company has a high rate of ‘Prefer Not To Answer’ on the Religion question, and just down the hallway, Department Y has a low ‘Prefer Not To Answer’ on Religion, and the difference between the two are statistically significant, we would want to ask: Why?
Interestingly, participants also have the option of putting in a false answer. They could just make stuff up and we’d never know. I remember many years ago as a rebellious young man, filling in the Australian Census form. I answered every question honestly except for ‘Occupation’ where I wrote ‘Goat Herder’, and when asked to describe the daily activities of my occupation I wrote ‘herding goats across a lush meadow’. I don’t know why. It was an act of defiance (maybe because I was studying Economics at University and wasn’t coping).
What would have been better for the Australian Bureau of Statistics at the time was if I were given a ‘Prefer Not To Answer’ option – an ‘out’ for the questions that I was uncomfortable with, for whatever reason. At Cultural Infusion, we believe that by selecting ‘Prefer Not To Answer’ rather than giving a false answer sends an incredibly important message and it is this: “There is an answer to this question, but I am uncomfortable in sharing it with you.”
In Utopia, there’d be next to zero ‘Prefer Not To Answer’ replies, because everyone would be confident and open and safe and keen to share and bring and be their whole self. But for now, Utopia is on Mars, and we have to be innovative and inspire change and spend zillions to get there.
This is all on my mind this week as Diversity Atlas have launched one beautiful update to our product, conceived and deployed by our CTO Rezza Moieni. It’s just one little statistic, on one widget, with one graph. It’s an analysis of ‘Prefer Not To Answer’ results against itself, horizontally.
Which of the questions had the highest rate of ‘Prefer Not To Answer’? Was it disability? Sexual orientation? Ancestry? Religion? This instant analysis of ‘Prefer Not To Answer’ figures is illuminating. It provides our customers with an insight as to which cultural or demographic attribute (acquired or intrinsic) causes the most level of discomfort in sharing, which in turn will allow our customers to roll out targeted DEI programs.
If you’d like to see a demo of Diversity Atlas, which would involve a 45-minute Zoom (or other platform) where you can just sit back, have a cup of something and let me take you on a tour, shoot me a message and we’ll set it up. My email is [email protected]
In the meantime, here’s the joke:
Jean-Paul Sartre goes to a café. He says to the waitress, “I’d like a coffee please, but hold the milk.”
The waitress says, “We’re out of milk, so I can hold the cream if you like.”
About the author:
Share this Post
If you'd like to get in touch and experience a one on one demo of Diversity Atlas.
Book a Demo